See your coverage clearly
It takes your coverage files (LCOV, Cobertura, GoCover, GCov), enriches them with static analysis, and outputs powerful reports in multiple formats..
Multiple Output Formats
Ingest reports from multiple instrumenters and output standardized data for any pipeline.
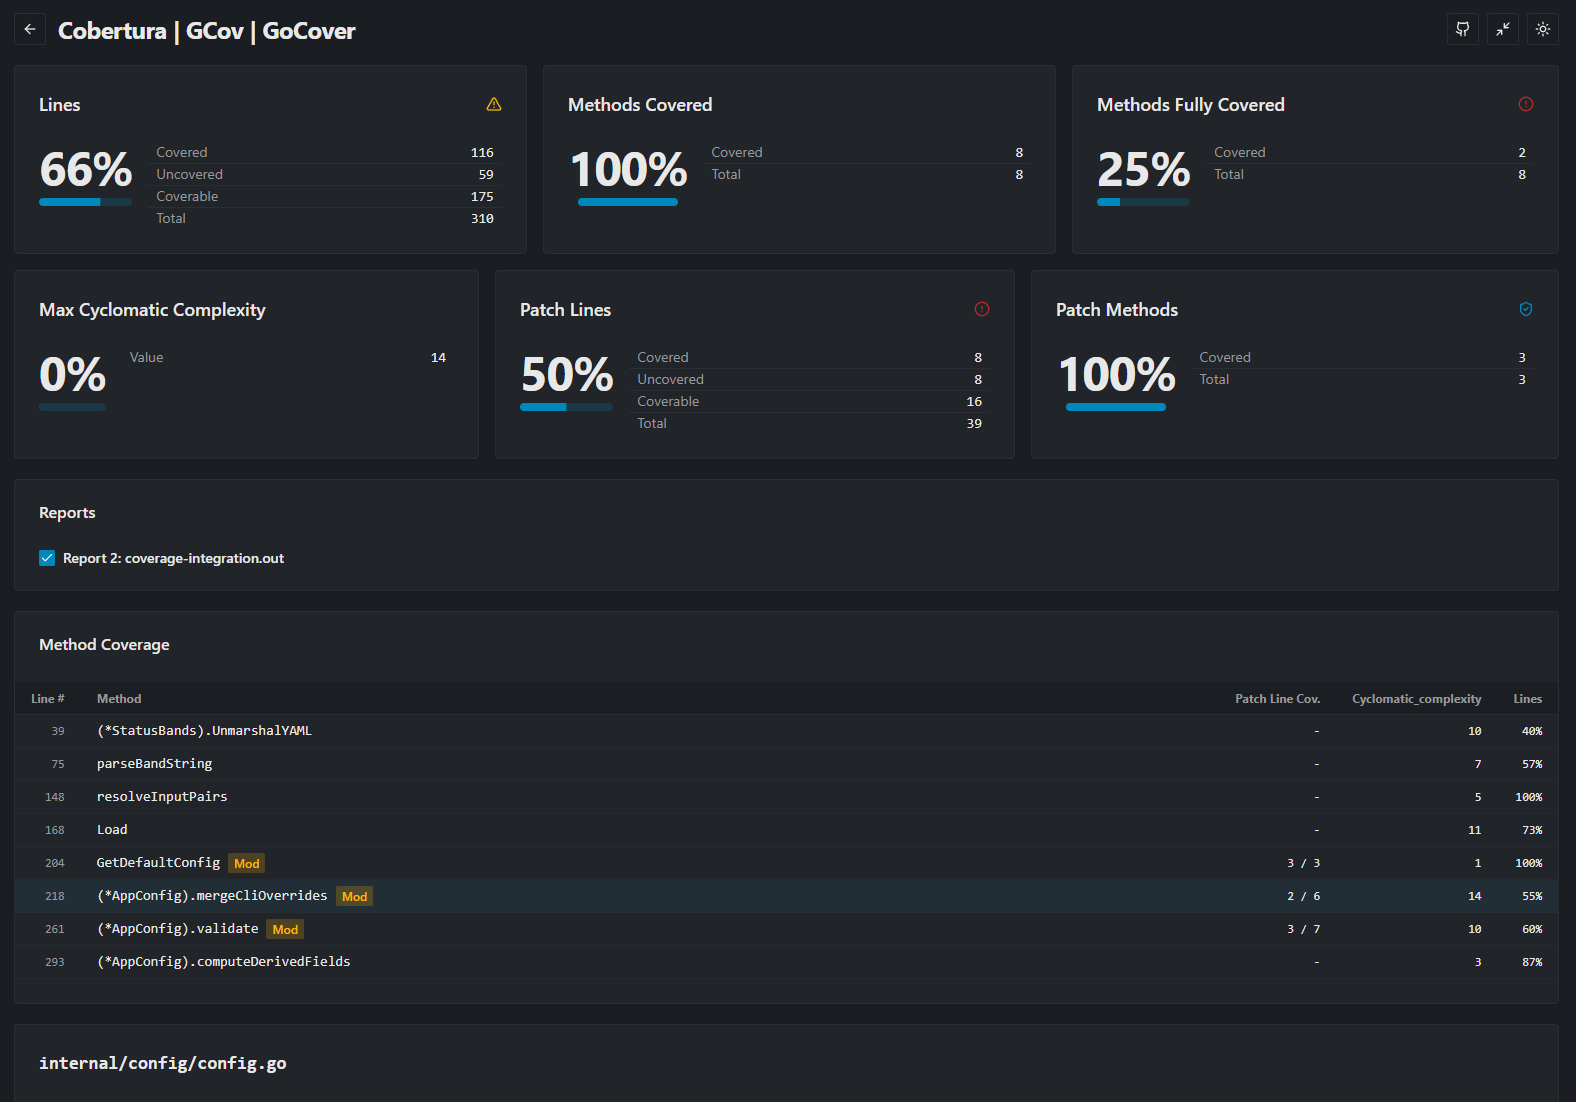
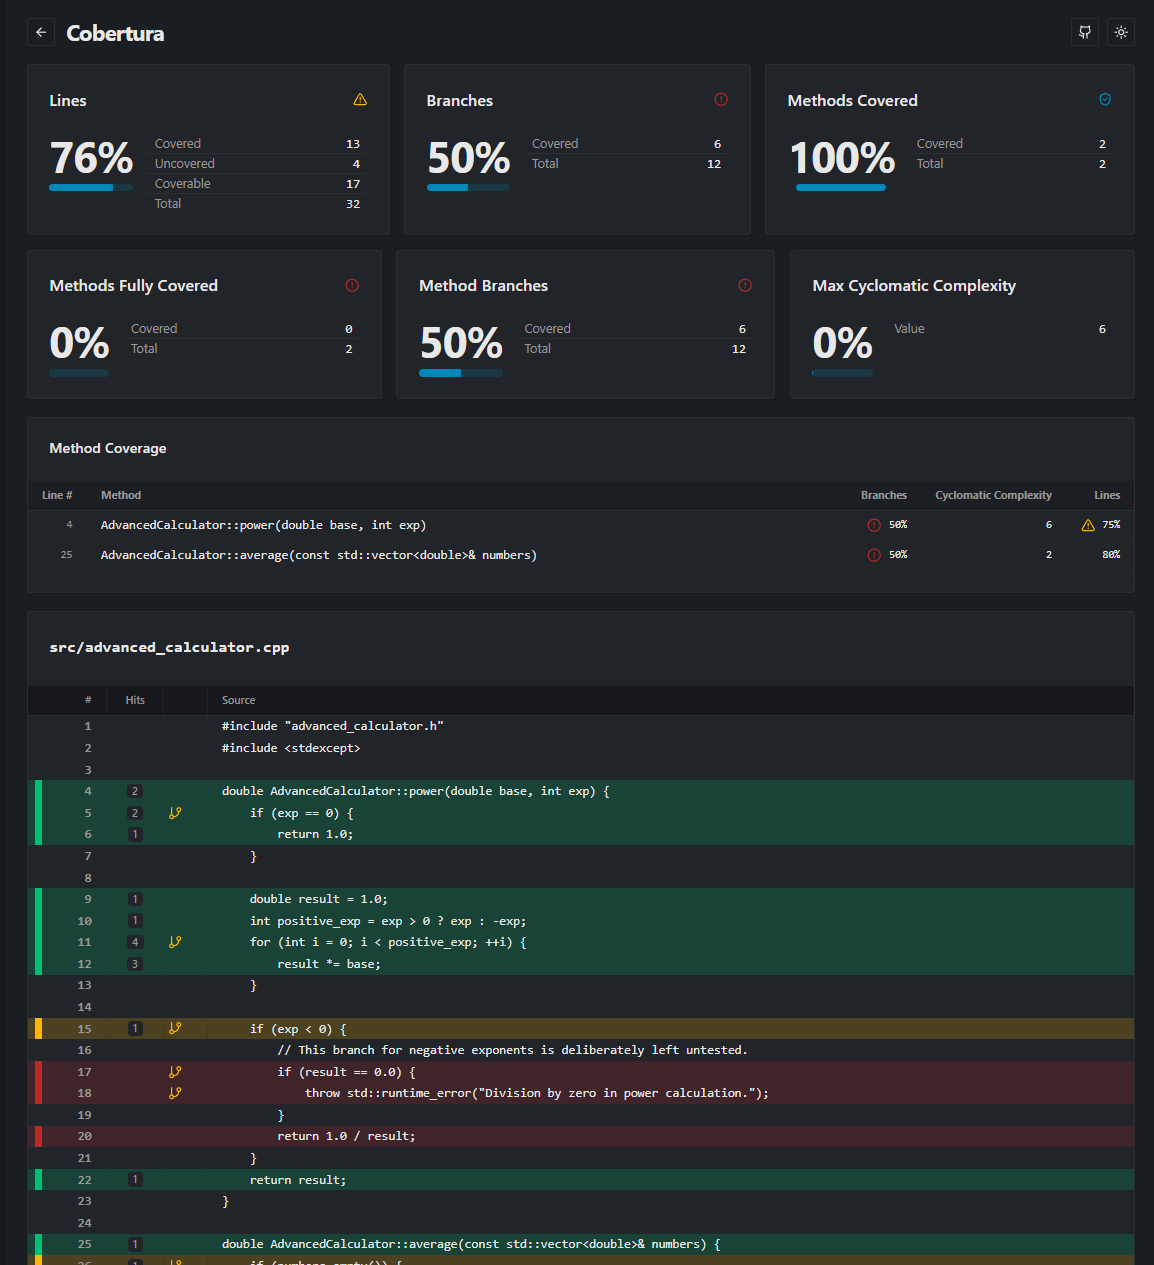
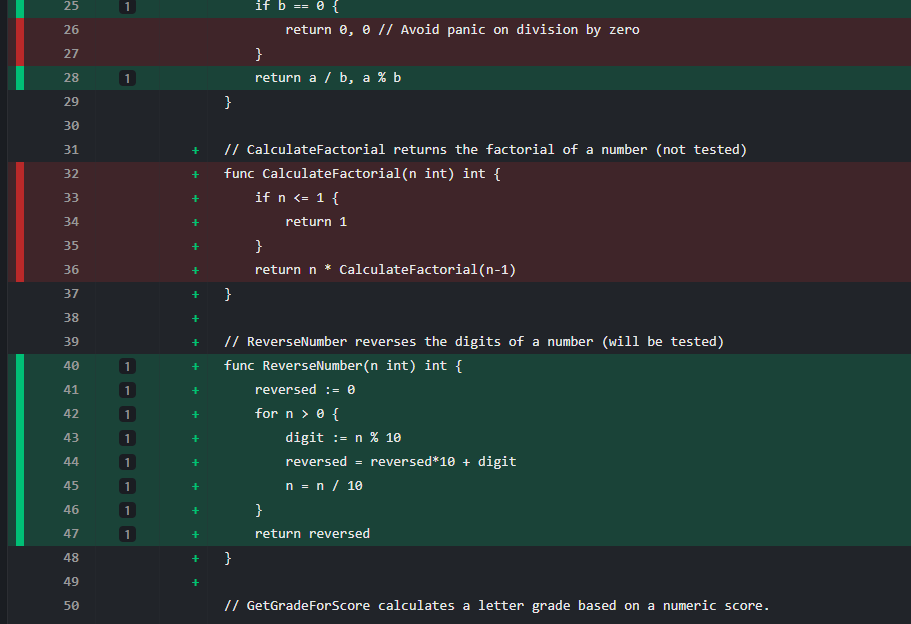
HTML Report
Interactive, searchable web dashboard. Visualize complexity, file trees, and coverage heatmaps.
Text Summary
Compact ASCII table output printed directly to stdout.
LCOV (.info)
Standard tracefile format compatible with legacy tools.
Raw JSON
Full dump of the internal metrics tree structure.
FAQ
No. Nanovision acts purely as a reporter and analyzer. You continue to run your tests with your standard language tools (e.g., 'go test', 'dotnet test', 'jest'), and Nanovision consumes the resulting coverage files to generate its reports.
Yes! Nanovision is completely open source and released under the Apache 2.0 license. You can use it freely in both commercial and personal projects without restriction.
Absolutely. Nanovision is distributed as a single binary with no external dependencies, making it incredibly easy to drop into GitHub Actions, GitLab CI, Jenkins, or any other CI environment.